


Table of contents


No headings in the article.
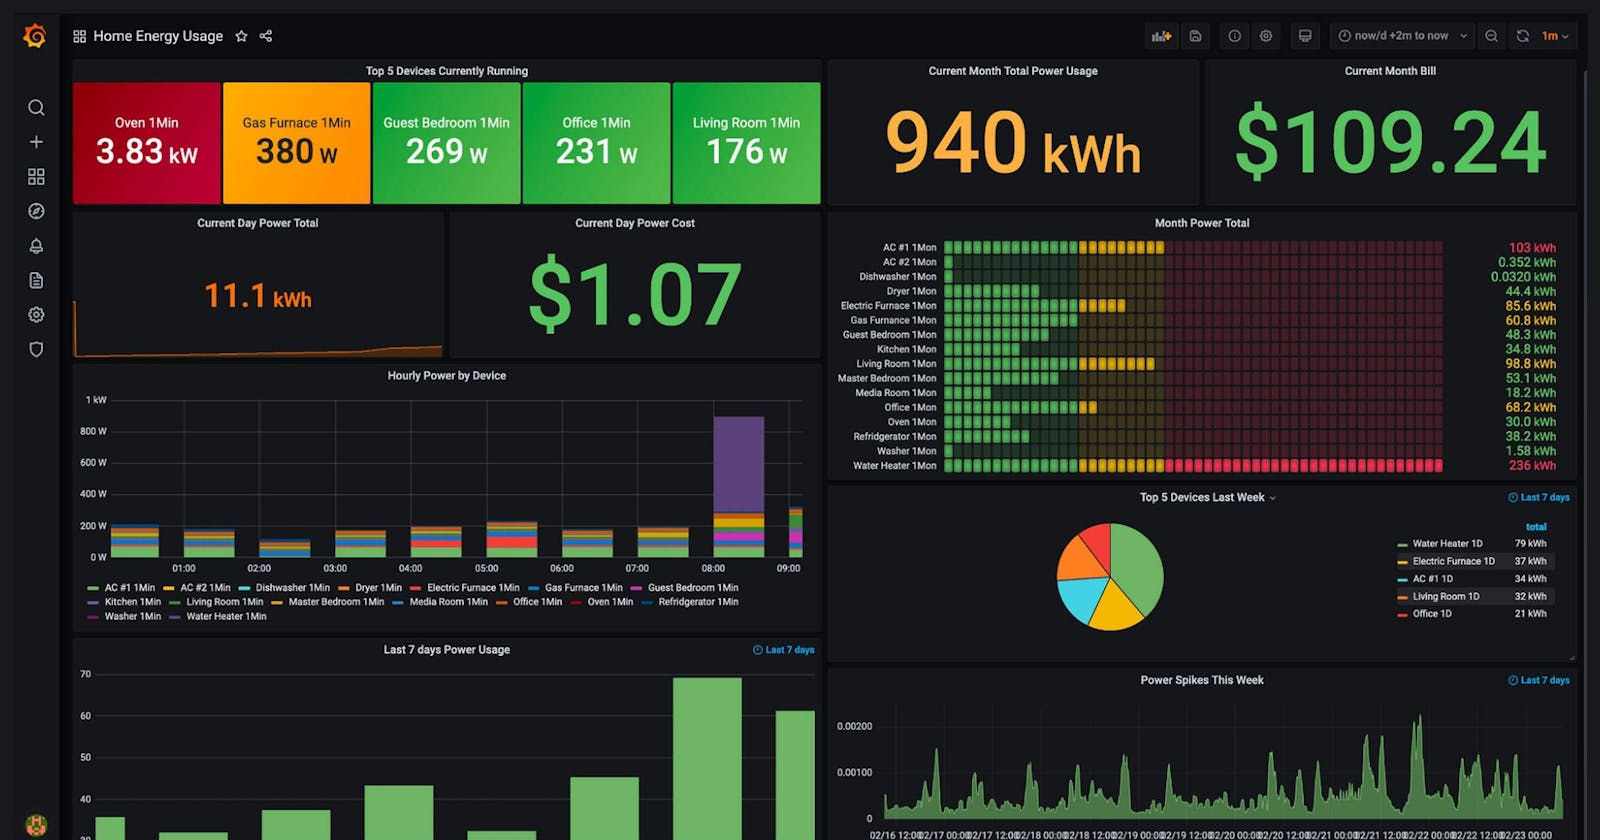
What comes to your mind when you hear the word 'Grafana'?

Let me walk you through it. Grafana is a powerful tool for data visualization and monitoring. It helps you observe and understand your technology by displaying data from various sources in easy-to-read graphs and charts. This tool is essential in tracking performance, like CPU and memory usage, and in detecting issues in your systems. With Grafana, you can quickly analyze and respond to problems, ensuring everything runs smoothly. It's like having a dashboard for your technology's health, making complex data simple and actionable
Let's Dive into data visualization like a pro! Discover how setting up Grafana on Ubuntu can unleash insightful analytics with a dash of style. It's easier than you think, and I’ll show you how in just a few straightforward steps.
Prepping Your System: Kick things off by ensuring your Ubuntu system is up-to-date. A quick refresh with
sudo apt update && sudo apt upgradesets the stage for smooth sailing.Installing Grafana: With a single command,
sudo apt install grafanayou’re on your way to data-driven insights. It's that simple💡to check grafana's version: grafana-server -vStarting the Service: Bring your Grafana to life with
sudo systemctl start grafana-server. It's like flipping the switch to illuminate your data world.Ensuring Grafana's Autonomy: Make sure Grafana stands ready on boot with
sudo systemctl enable grafana-server. It’s like setting the stage for analytics to greet you at every login- 💡To check the status hit: sudo systemctl status grafana-server
In the future to stop and restart the Grafana, the commands are:
 sudo service grafana-server restart
 sudo service grafana-server stop
Next up, Enable Grafana's Magic: Open Firewall for TCP Port 3000, the Default Gateway to Grafana's Insights!
sudo ufw allow 3000/tcp
That's it! You have successfully installed Grafana on Ubuntu. Start creating dashboards and visualizing your data now.
Accessing Grafana Dashboard: Accessing your new Grafana dashboard is as easy as pie. Just point your browser to http://<your-ip>:3000 and voilà!
you will be redirected to grafana's login page, you have to log in with the default credentials

Final Touches: Secure your dashboard with a unique username and password, and you’re all set to explore the vast ocean of data at your fingertips.
You've now unlocked the power of Grafana on your Ubuntu machine. Let your data storytelling journey begin!!
Are you eager to dive deeper into Grafana’s features? Head over to Official Grafana Documentation for more detailed adventures in data visualization!
That's all for now. See you in our next reading,
thank you :)